Waste (WS)
Table of contents
The Total volume of Inorganic Waste produced this year
| Types of Waste | North Bangkok Campus | Thewet Campus | Chotiwet Campus | Phra Nakhon Commercial Campus | Chom Thong Campus | This year amount (tons) | Last year amount (tons) | Reduced (tons) |
| – Soft plastic, foam, etc. (in dumpsters) | 241 | 80 | 48 | 142 | 1 | 512 | 518.76 | 6.76 |
| — Hard plastic, can, glass and hard paper | 4 | 1 | 2.8 | 1.8 | 0.05 | 9.65 | 9.9 | 0.25 |
| – Printed paper | 0.7/td> | 5.8 | 1.8 | 2.5 | – | 10.8 | 111.03 | 0.23 |
| Total | 245.7 | 86.8/td> | 52.6 | 146.3 | 1.05 | 532.45 | 539.69 | 7.24 |
Description:
The table presents the total volume of inorganic, non-toxic waste generated across all five campuses of Rajamangala University of Technology Phra Nakhon by staff, students, and food stall operators during the current reporting year. The university produced a combined 532.45 tons of inorganic waste, showing a reduction of 7.24 tons compared to last year’s 539.69 tons.
Among the campuses, the North Bangkok Campus generated the highest amount at 245.7 tons, followed by the Phra Nakhon Commercial Campus with 146.3 tons, while the other campuses contributed smaller portions.
Soft plastics and foam remained the dominant component, amounting to 512 tons, which is a decrease of 6.76 tons from last year’s 518.76 tons. In addition, the university generated 9.65 tons of hard plastics, metal cans, glass, and hard paper (down 0.25 tons from 9.9 tons last year) and 10.8 tons of printed paper (down 0.23 tons from 11.03 tons last year).
This overall reduction demonstrates the university’s ongoing efforts to minimize waste generation and promote sustainable waste management practices, including initiatives to encourage reuse and recycling in collaboration with local recycling servic.
Additional evidence link (i.e., for videos, more images, or other files that are not included in this file):
https://green.rmutp.ac.th/sustainability-report/
Total volume of Inorganic Waste produced last year
| Types of Waste | North Bangkok Campus | Thewet Campus | Chotiwet Campus | Phra Nakhon Commercial Campus | Chom Thong Campus | Amount (tons) |
| Inorganic non-toxic | 247.23 | 88.78 | 54.3 | 148.43 | 0.95 | 539.69 |
| – Soft plastic, foam, etc. (in dumpsters) | 242.37 | 81.92 | 49.61 | 143.99 | 0.87 | 518.76 |
| – Hard plastic, can, glass and hard paper | 4.13 | 1.01 | 2.85 | 1.83 | 0.08 | 9.9 |
| – Printed paper | 0.73 | 5.85 | 1.84 | 2.61 | – | 11.03 |
Description:
The table presents the volume of inorganic, non-toxic waste generated across all five campuses of Rajamangala University of Technology Phra Nakhon by staff, students, and food stall operators during the current reporting year. The total amount reached 539.69 tons, with the North Bangkok Campus contributing the largest portion at 247.23 tons, followed by the Phra Nakhon Commercial Campus at 148.43 tons.
The majority of this waste stream consisted of soft plastics and foam, totaling 518.76 tons, which are currently stored in dumpsters awaiting collection by municipal waste services. The remaining inorganic, non-toxic waste comprised hard plastics, metal cans, glass, and hard paper (9.9 tons) as well as printed paper (11.03 tons).
Additional evidence link (i.e., for videos, more images, or other files that are not included in this file):
https://green.rmutp.ac.th/sustainability-report/
The Total Volume of Inorganic Waste Treated
| Types of Waste | Amount (tons) | ||
| Total | Reused | Recycled | |
| – soft plastic, foam, etc. | 512 | – | – |
| – hard plastic, hard paper and glass | 9.65 | – | 9.2 |
| – printed paper | 10.8 | 5.5 | 6.1 |
| Total | 532.45 | 5.5 | 15.3 |
Description:
Inorganic waste was generated across all university campuses by various stakeholders, including staff, students, and food stall operators. The majority of this waste consisted of soft plastics and foam (512 tons), which are primarily handled by municipal waste services, as previously noted.
The table above presents the portion of inorganic, non-toxic waste that the university has managed through reuse and recycling initiatives. Out of a total of 532.45 tons of inorganic waste, 5.5 tons of printed paper were reused, while 15.3 tons were recycled—comprising 6.1 tons of printed paper and 9.2 tons of hard plastic, hard paper, and glass.
In total, 20.8 tons of inorganic waste—equivalent to approximately 3.9% of all inorganic, non-toxic waste—were successfully treated through reuse and recycling efforts. This demonstrates the university’s ongoing commitment to reducing waste sent to landfills and promoting sustainable resource management practices.
Additional evidence link (i.e., for videos, more images, or other files that are not included in this file):
https://green.rmutp.ac.th/sustainability-report/
Inorganic waste treatment
Description:
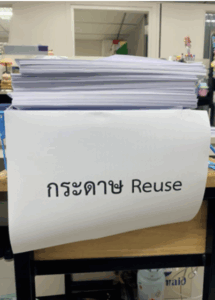
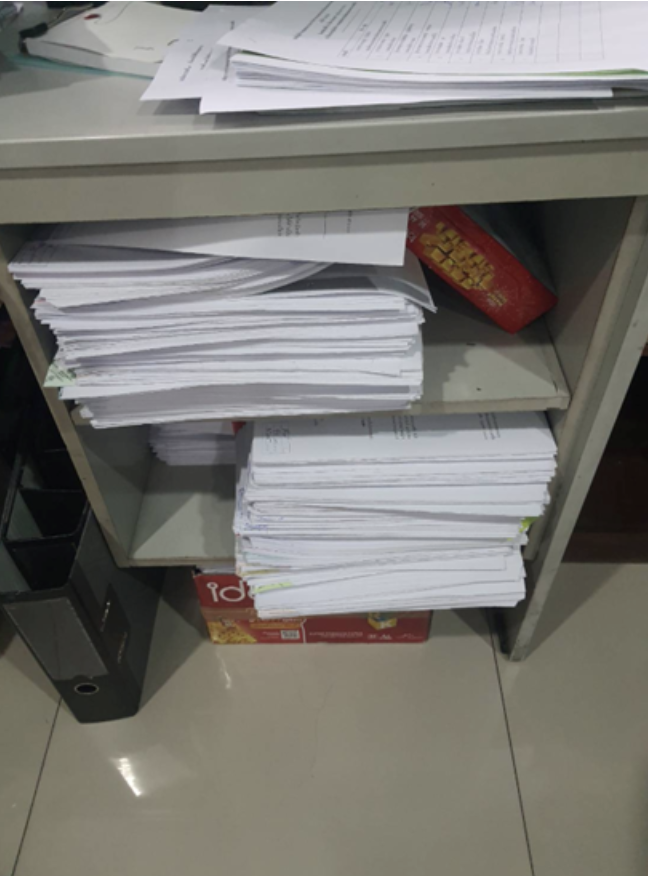
Rajamangala University of Technology Phra Nakhon has prioritized sustainable waste management practices, with a particular focus on reducing wastepaper usage. In response to environmental concerns, the university has introduced several initiatives aimed at minimizing paper consumption and fostering a more sustainable working culture. These include organized activities to encourage the reuse of one-sided printed paper, which are actively practiced by both students and staff. This initiative has helped cultivate greater environmental awareness and responsibility within the campus community.
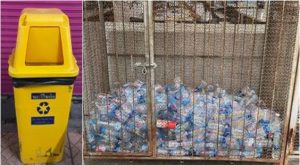
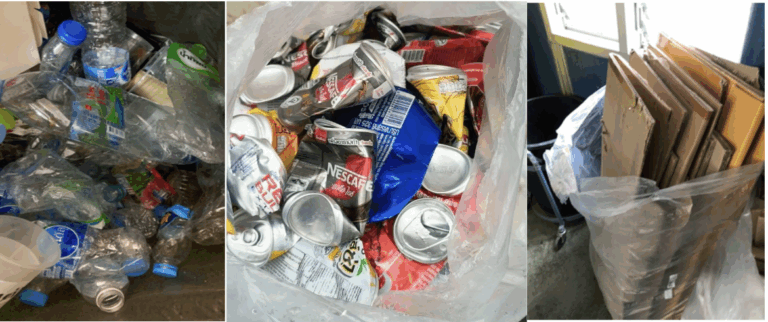
In addition to paper reduction efforts, the university has implemented a continuous campaign for sorting and recycling specific types of inorganic waste. Plastic bottles, metal cans, hard paper, and glass are separated at source and collected by local recycling services for proper treatment. This approach not only reduces the amount of waste sent to landfills but also supports broader environmental objectives, including resource conservation and waste minimization.
As a result of these combined efforts, the university successfully treated 20.8 tons of inorganic waste—comprising 5.5 tons of reused printed paper and 15.3 tons of recycled materials—which represents approximately 3.9% of the total 532.45 tons of inorganic, non-toxic waste generated. While this marks meaningful progress, the university remains committed to expanding its recycling programs, enhancing awareness campaigns, and improving waste sorting infrastructure to further reduce its environmental footprint in the coming years..
Additional evidence link (i.e., for videos, more images, or other files that are not included in this file):
https://green.rmutp.ac.th/sustainability-report/
Total volume of Toxic Waste produced this year

Toxic waste: lab chemicals and oils, electronic equipment, and batteries.
| Types of Waste | This year amount (tons) | Last year amount (tons) | Increase (tons) |
| – electronics | 0.7 | 0.61 | 0.09 |
| – lab chemicals | 0.96 | 0.94 | 0.02 |
| – batteries | 0.22 | 0.18 | 0.04 |
| Total | 1.88 | 1.73 | 0.15 |
Description:
The table presents the total amount of toxic waste generated by Rajamangala University of Technology Phra Nakhon during the current reporting year, compiled as a combined figure from all campuses. This toxic waste primarily consists of laboratory chemicals, discarded electronic equipment, and used batteries, which require careful handling and disposal to prevent environmental and health risks.
In total, the university produced 1.88 tons of toxic waste this year, reflecting a slight increase from 1.73 tons last year. This rise is attributed to expanded academic and research activities across the university, which resulted in greater use of laboratory chemicals (0.96 tons), increased disposal of electronic equipment (0.7 tons), and higher volumes of used batteries (0.22 tons). All hazardous materials are stored securely and managed in accordance with environmental safety regulations.
The university remains committed to improving its hazardous waste management system, including upgrading storage facilities, strengthening partnerships with certified disposal companies, and implementing strategies to reduce the generation of toxic waste as university activities continue to grow.
Additional evidence link (i.e., for videos, more images, or other files that are not included in this file):
https://green.rmutp.ac.th/sustainability-report/
Total volume of Toxic Waste produced last year
| Types of Waste | This year amount (tons) | Last year amount (tons) | Increase (tons) |
| – electronics | 0.7 | 0.61 | 0.09 |
| – lab chemicals | 0.96 | 0.94 | 0.02 |
| – batteries | 0.22 | 0.18 | 0.04 |
| Total | 1.88 | 1.73 | 0.15 |
Description:
The table presents the total amount of toxic waste generated by Rajamangala University of Technology Phra Nakhon during the previous year, reported as a combined figure from all campuses due to the relatively small quantities involved. This toxic waste primarily consisted of laboratory chemicals, discarded electronic equipment, and used batteries, all of which require strict handling and disposal procedures to prevent environmental contamination and health risks.
In total, the university produced 1.73 tons of toxic waste last year, with laboratory chemicals representing the largest portion at 0.94 tons, followed by electronic waste at 0.61 tons and used batteries at 0.18 tons. These materials were securely stored and managed in accordance with environmental safety regulations to ensure proper treatment and disposal.
Additional evidence link (i.e., for videos, more images, or other files that are not included in this file):
https://green.rmutp.ac.th/sustainability-report/
The Total Volume of Toxic Waste Treated
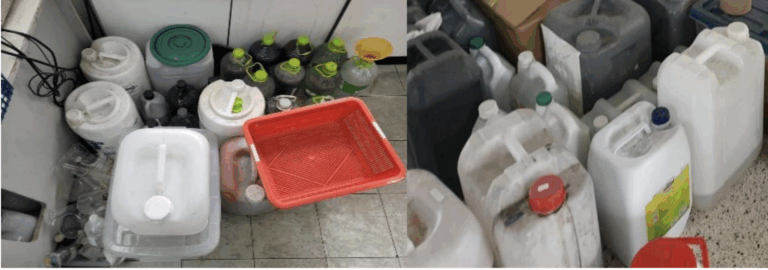
Classified lab chemicals

% treated = 1.3/1.88 * 100% = 69.15%
Description:
The table presents an overview of the treatment of toxic waste generated at Rajamangala University of Technology Phra Nakhon during the current reporting year. A total of 1.88 tons of toxic waste was produced, consisting of 0.7 tons of electronic equipment, 0.96 tons of laboratory chemicals, and 0.22 tons of used batteries.
Of this total, 1.3 tons (69.15%) were properly classified and treated through certified hazardous waste management channels. This included the full 0.96 tons of laboratory chemicals, which were securely packaged and transferred to a licensed hazardous waste company, along with 0.27 tons of electronic equipment and 0.07 tons of used batteries that were safely collected for treatment. These actions are essential for mitigating the environmental and health risks associated with hazardous materials.
The university continues to strengthen its hazardous waste management system by ensuring proper classification, secure storage, and certified treatment of all toxic materials, reflecting its ongoing commitment to environmental safety and sustainable campus operations.
Additional evidence link (i.e., for videos, more images, or other files that are not included in this file):
https://green.rmutp.ac.th/sustainability-report/

